
How to Use TikTok Ads Reporting Dashboard: A Complete Guide
TikTok has become a powerful platform for businesses looking to reach a massive and engaged audience. With over 1 billion active users, it's no surprise that many marketers are turning to TikTok Ads to drive brand awareness, engagement, and conversions. However, with such a large audience comes the need for effective tracking and measurement of ad performance. This is where the TikTok Ads Reporting Dashboard becomes essential.
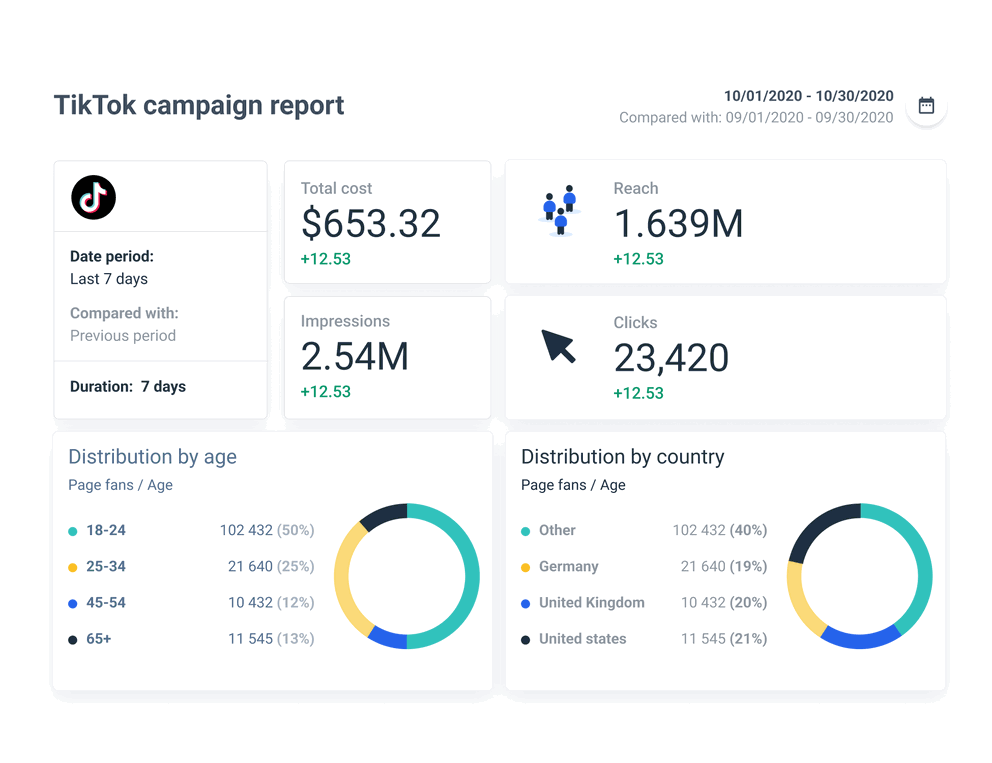
The TikTok Ads Reporting Dashboard is a comprehensive tool that allows advertisers to track, analyze, and optimize their ad campaigns in real-time. It provides insights into key metrics such as impressions, clicks, conversions, and return on ad spend (ROAS), enabling marketers to make data-driven decisions. In this guide, we’ll walk you through how to use the TikTok Ads Reporting Dashboard effectively.
Understanding the Key Metrics
Before diving into the dashboard, it’s important to understand the key metrics that will help you evaluate your campaign performance:
1. Impressions
- What it measures: The total number of times your ad was shown to users.
- Why it matters: Impressions indicate how many people have seen your ad, which is crucial for brand awareness.
- How to calculate: Impressions = Reach × Frequency
- Benchmark: Varies based on audience size and settings.
2. Clicks (Destination)
- What it measures: The number of times users clicked on your ad and were redirected to a specific destination (e.g., website, app).
- Why it matters: Clicks show how well your ad resonates with your target audience.
- How to calculate: Automatically tracked by TikTok.
3. Click-Through Rate (CTR)
- What it measures: The percentage of users who clicked on your ad after seeing it.
- Why it matters: CTR is a strong indicator of ad engagement and message effectiveness.
- How to calculate: CTR = (Clicks / Impressions) × 100
- Benchmark: Average is around 0.84%.
4. Conversion Rate (CVR)
- What it measures: The percentage of users who clicked on your ad and completed a desired action (e.g., purchase, form submission).
- Why it matters: CVR tells you how effectively your ad drives conversions.
- How to calculate: CVR = (Conversions / Clicks) × 100
- Benchmark: Good CVR ranges from 2% to 5%.
5. Cost per Click (CPC)
- What it measures: The cost you pay when someone clicks on your ad.
- Why it matters: CPC helps you understand the efficiency of your ad spend.
- How to calculate: CPC = Ad Spend / Clicks
- Benchmark: Typically between $0.25 and $4.
6. Cost per View (CPV)
- What it measures: The average cost you pay when a user views your video.
- Why it matters: CPV is useful for brand awareness campaigns.
- How to calculate: CPV = Total Cost / Views
- Benchmark: Usually between $0.10 and $0.30.
7. Cost per Action (CPA)
- What it measures: The cost you pay for a specific action taken by a user after viewing your ad.
- Why it matters: CPA helps you measure the effectiveness of your ad in driving valuable actions.
- How to calculate: CPA = Ad Spend / Conversions
8. Cost per 1000 Impressions (CPM)
- What it measures: The cost you pay for displaying your ad to 1000 users.
- Why it matters: CPM is ideal for brand awareness campaigns.
- How to calculate: CPM = (Ad Spend / Impressions) × 1000
- Benchmark: Average CPM on TikTok is $9.16.
9. Ad Spend
- What it measures: The total cost of your ad campaigns.
- Why it matters: Ad spend helps you track your budget allocation and overall campaign performance.
10. Return on Ad Spend (ROAS)
- What it measures: The revenue generated from your ads compared to the cost of those ads.
- Why it matters: ROAS is the ultimate metric for evaluating the profitability of your campaigns.
- How to calculate: ROAS = Total Revenue from Ads / Total Ad Spend
- Benchmark: A good ROAS ratio is 3:1 or higher.
Navigating the TikTok Ads Reporting Dashboard
Once you’ve set up your TikTok Ads account, you can access the Ads Manager to view and analyze your campaign performance. Here’s how to navigate the reporting dashboard:
Step 1: Access the Ads Manager
- Log in to your TikTok Ads account.
- Navigate to the Ads Manager section.
Step 2: Select Your Campaign
- Choose the campaign you want to analyze.
- You can filter by date range, ad group, or specific ad creatives.
Step 3: View Key Metrics
- The dashboard will display your campaign’s performance across various metrics, including impressions, clicks, conversions, and ROAS.
- You can also view breakdowns by device, location, and time of day.
Step 4: Customize Reports
- Use the Custom Report feature to create tailored reports based on specific metrics and time frames.
- You can export these reports in CSV or Excel format for further analysis.
Step 5: Track Performance Over Time
- Use the Performance Graph to visualize how your campaign’s metrics have evolved over time.
- This helps you identify trends and make informed adjustments to your strategy.
Using Third-Party Tools for Enhanced Reporting
While TikTok’s native dashboard provides a solid foundation, many marketers opt for third-party tools like Coupler.io, Looker Studio, or Power BI to gain deeper insights and streamline their reporting process. These tools allow you to:
- Consolidate data from multiple platforms (e.g., Facebook, Google, TikTok).
- Create custom dashboards with real-time updates.
- Automate data refreshes and scheduling.
For example, the PPC Multi-Channel Dashboard from Coupler.io lets you compare metrics like CPM, CPC, and ROAS across different platforms, helping you optimize your ad spend more effectively.
Best Practices for Using the TikTok Ads Reporting Dashboard
To get the most out of the TikTok Ads Reporting Dashboard, consider the following best practices:
- Regularly review your metrics: Check your dashboard daily or weekly to stay on top of your campaign performance.
- Test and optimize: Use A/B testing to experiment with different ad creatives, targeting options, and bidding strategies.
- Focus on high-performing metrics: Prioritize metrics that align with your campaign goals (e.g., ROAS for sales-focused campaigns, CTR for brand awareness).
- Leverage automation: Use tools like Coupler.io to automate data collection and reporting, saving you time and reducing errors.
Conclusion
The TikTok Ads Reporting Dashboard is a powerful tool that enables marketers to track, analyze, and optimize their ad campaigns effectively. By understanding the key metrics and using the dashboard strategically, you can improve your ad performance, increase ROI, and achieve your marketing goals. Whether you're running a small-scale campaign or managing multiple accounts, the right reporting tools and practices can make all the difference in your success on TikTok.
Posting Komentar untuk "How to Use TikTok Ads Reporting Dashboard: A Complete Guide"
Posting Komentar