
How to Use TikTok Ad Reporting Dashboard for Effective Campaign Analysis
The TikTok Ad Reporting Dashboard is a powerful tool that allows advertisers to track, analyze, and optimize their ad campaigns. With the rise of TikTok as a leading social media platform, understanding how to use its reporting features effectively can significantly impact the success of your marketing strategies. This article will guide you through the key features of the TikTok Ad Reporting Dashboard and how to leverage them for better campaign performance.
Understanding the TikTok Ad Reporting Dashboard
The TikTok Ad Reporting Dashboard is part of the TikTok Ads Manager, which provides a centralized hub for managing all your advertising activities on the platform. It offers detailed insights into various metrics such as impressions, clicks, engagement rates, and conversion data. Here’s what you need to know about the dashboard:
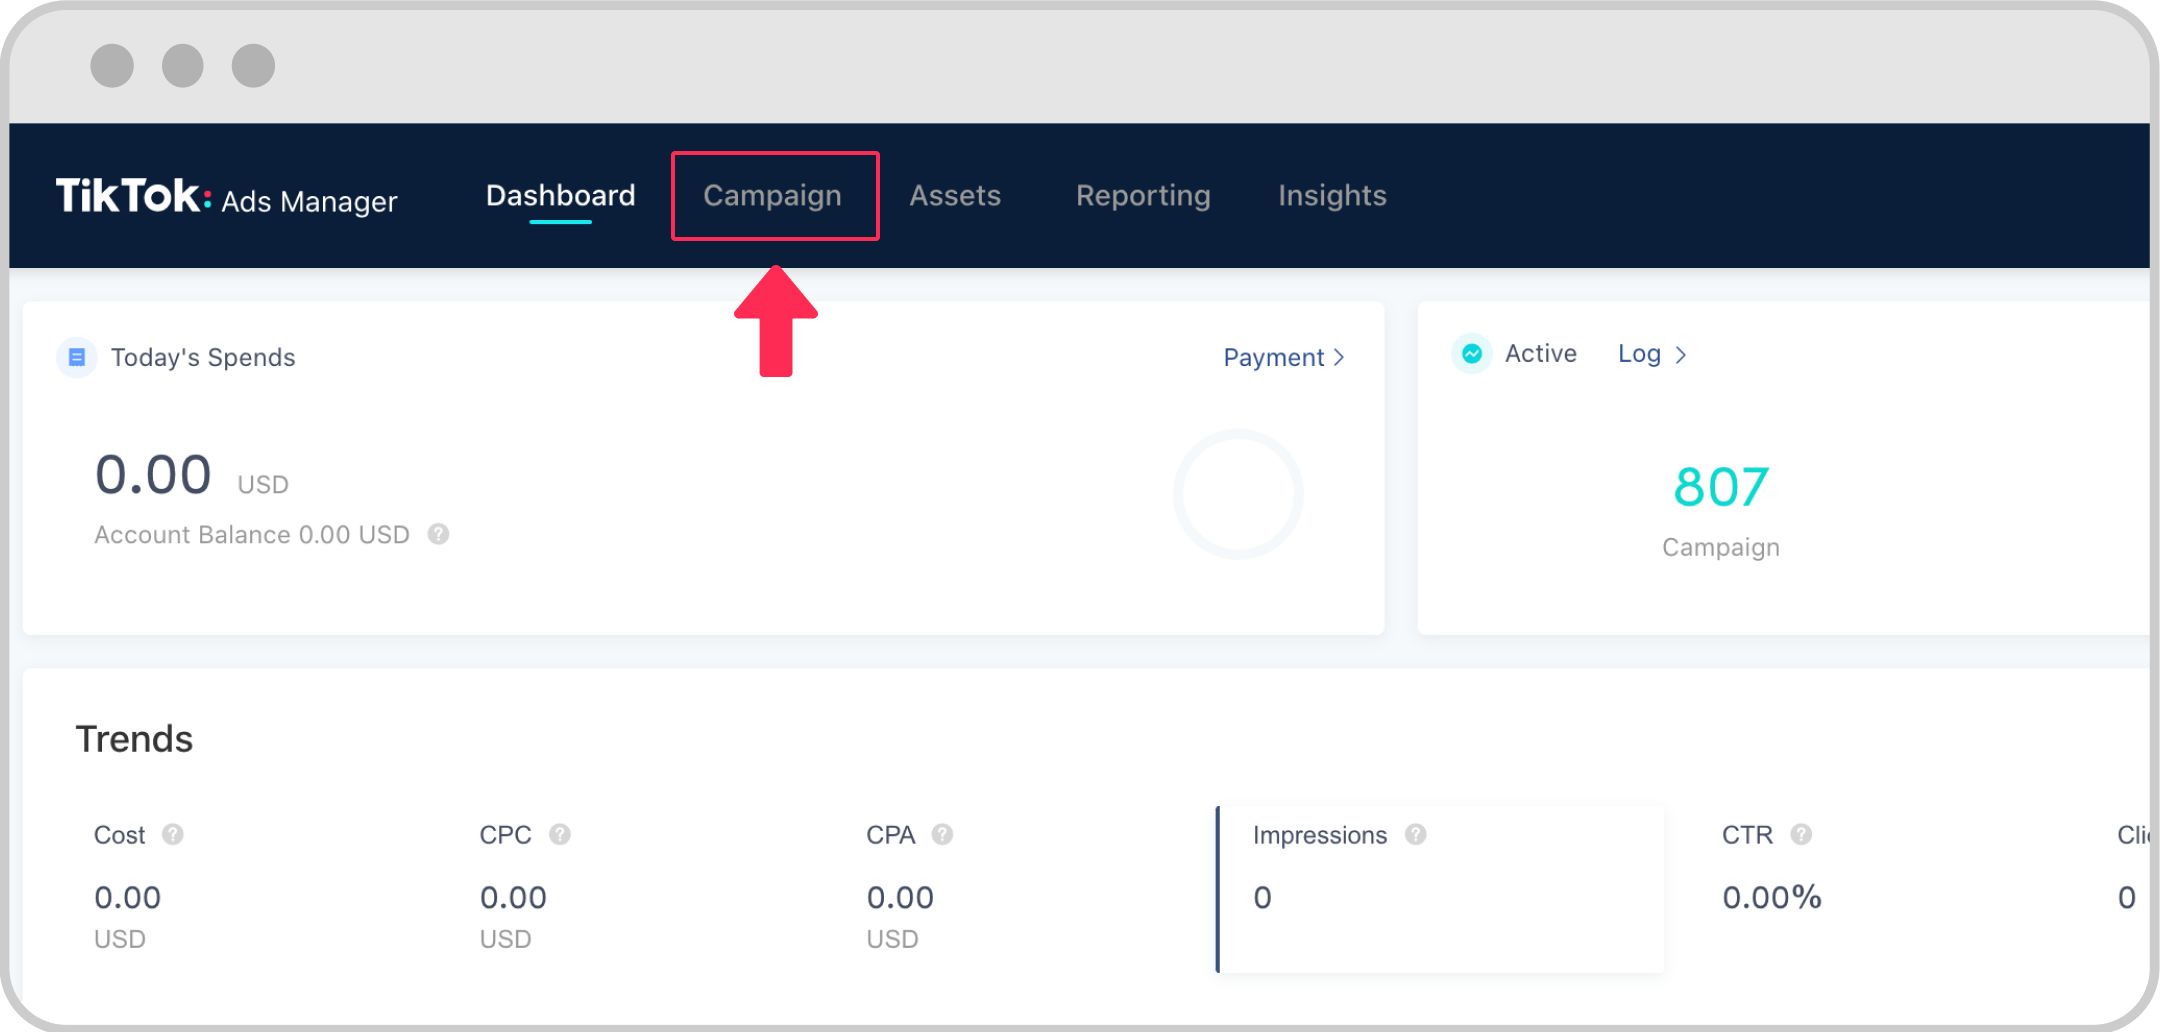
1. Accessing the Dashboard
To access the TikTok Ad Reporting Dashboard, you must first have a TikTok Business Account. Once you’ve created your account, navigate to the "Ads Manager" section within the TikTok Business Dashboard. From there, select the specific campaign or ad group you want to analyze.
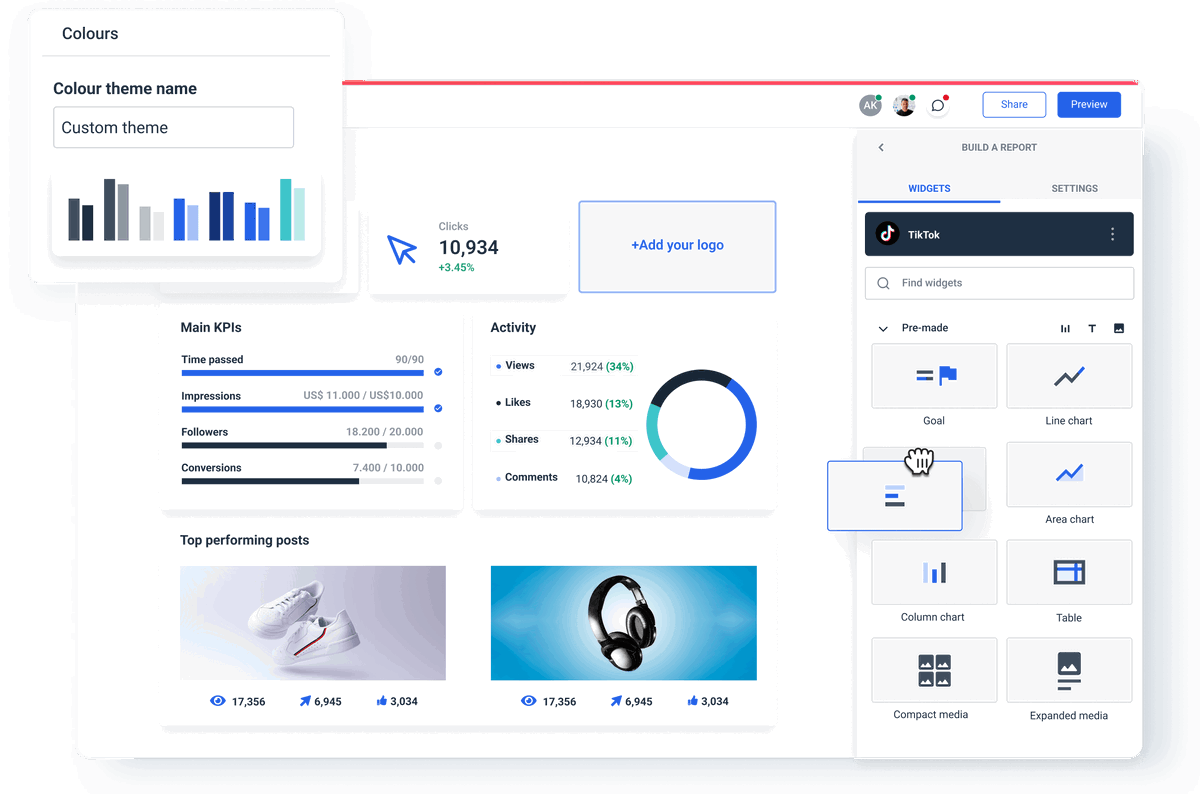
2. Key Metrics to Track
The dashboard provides several key metrics that are essential for evaluating the performance of your ads. These include:
- Impressions: The number of times your ad was shown.
- Clicks: The number of times users clicked on your ad.
- Engagement Rate: The percentage of users who interacted with your ad (likes, comments, shares).
- Conversion Rate: The percentage of users who completed a desired action (e.g., making a purchase, signing up for a newsletter).
- Cost Per Click (CPC): The average cost you pay for each click on your ad.
- Return on Ad Spend (ROAS): A measure of how much revenue you generate for every dollar spent on ads.
3. Customizing Your Reports
One of the most useful features of the TikTok Ad Reporting Dashboard is the ability to customize your reports. You can filter data by date range, ad type, audience demographics, and more. This allows you to gain deeper insights into specific aspects of your campaigns.
4. Exporting Data
The dashboard also allows you to export your data in various formats, including CSV and Excel. This is particularly useful if you want to perform further analysis using external tools or share the data with your team.
Optimizing Your Campaigns Using the Dashboard
Once you understand the basics of the TikTok Ad Reporting Dashboard, you can start using it to optimize your campaigns. Here are some strategies to consider:
1. Identify High-Performing Ads
By analyzing the metrics provided in the dashboard, you can identify which ads are performing well and which ones need improvement. Focus on the ads that have high engagement rates and low costs per click. These are typically the most effective at driving conversions.
2. Adjust Targeting Strategies
The dashboard provides detailed demographic information about your audience, including age, gender, location, and interests. Use this data to refine your targeting strategies. For example, if your ads are not performing well among a particular age group, consider adjusting your targeting to focus on a different segment.
3. Test Different Ad Formats
TikTok offers various ad formats, including in-feed videos, brand takeovers, and shopping ads. Use the dashboard to compare the performance of different ad formats and determine which ones resonate best with your audience. This will help you allocate your budget more effectively.
4. Monitor Trends and Adjust Accordingly
The TikTok Ad Reporting Dashboard allows you to track trends over time. By monitoring changes in your metrics, you can identify patterns and make informed decisions about your advertising strategy. For example, if you notice a decline in engagement, consider updating your content or adjusting your targeting parameters.
Advanced Features of the TikTok Ad Reporting Dashboard
In addition to the basic features, the TikTok Ad Reporting Dashboard offers several advanced features that can enhance your campaign analysis:
1. A/B Testing
The dashboard supports A/B testing, allowing you to compare different versions of your ads. This feature is particularly useful for testing variations in headlines, visuals, and call-to-action buttons. By analyzing the performance of each version, you can determine which elements are most effective at driving engagement.
2. Audience Insights
The audience insights feature provides valuable information about your target audience, including their interests, behaviors, and preferences. Use this data to create more personalized and relevant ad content that resonates with your audience.
3. Competitor Analysis
While the TikTok Ad Reporting Dashboard does not directly provide competitor data, you can use third-party tools to analyze your competitors’ ads and strategies. This can help you identify opportunities to differentiate your campaigns and gain a competitive edge.
Conclusion
The TikTok Ad Reporting Dashboard is an essential tool for any advertiser looking to maximize the effectiveness of their campaigns on the platform. By leveraging the insights provided by the dashboard, you can make data-driven decisions that lead to better performance and higher returns on your advertising investment. Whether you're a seasoned marketer or just starting out, mastering the TikTok Ad Reporting Dashboard will give you a significant advantage in the competitive world of social media advertising.
Posting Komentar untuk "How to Use TikTok Ad Reporting Dashboard for Effective Campaign Analysis"
Posting Komentar