
How to Navigate TikTok Ads Reporting Interface: A Complete Guide
TikTok has become a powerful platform for businesses looking to reach a vast and engaged audience. With over 61% of US Gen Z using TikTok monthly, it's no surprise that marketers are eager to tap into this space. However, success on TikTok requires more than just creating content—it involves understanding how to effectively use the TikTok Ads Reporting Interface to track performance, optimize campaigns, and stay ahead of the competition.
In this guide, we'll walk you through everything you need to know about navigating the TikTok Ads reporting interface. Whether you're a beginner or an experienced marketer, this article will help you unlock valuable insights and improve your advertising strategy.
Understanding the TikTok Ads Reporting Interface
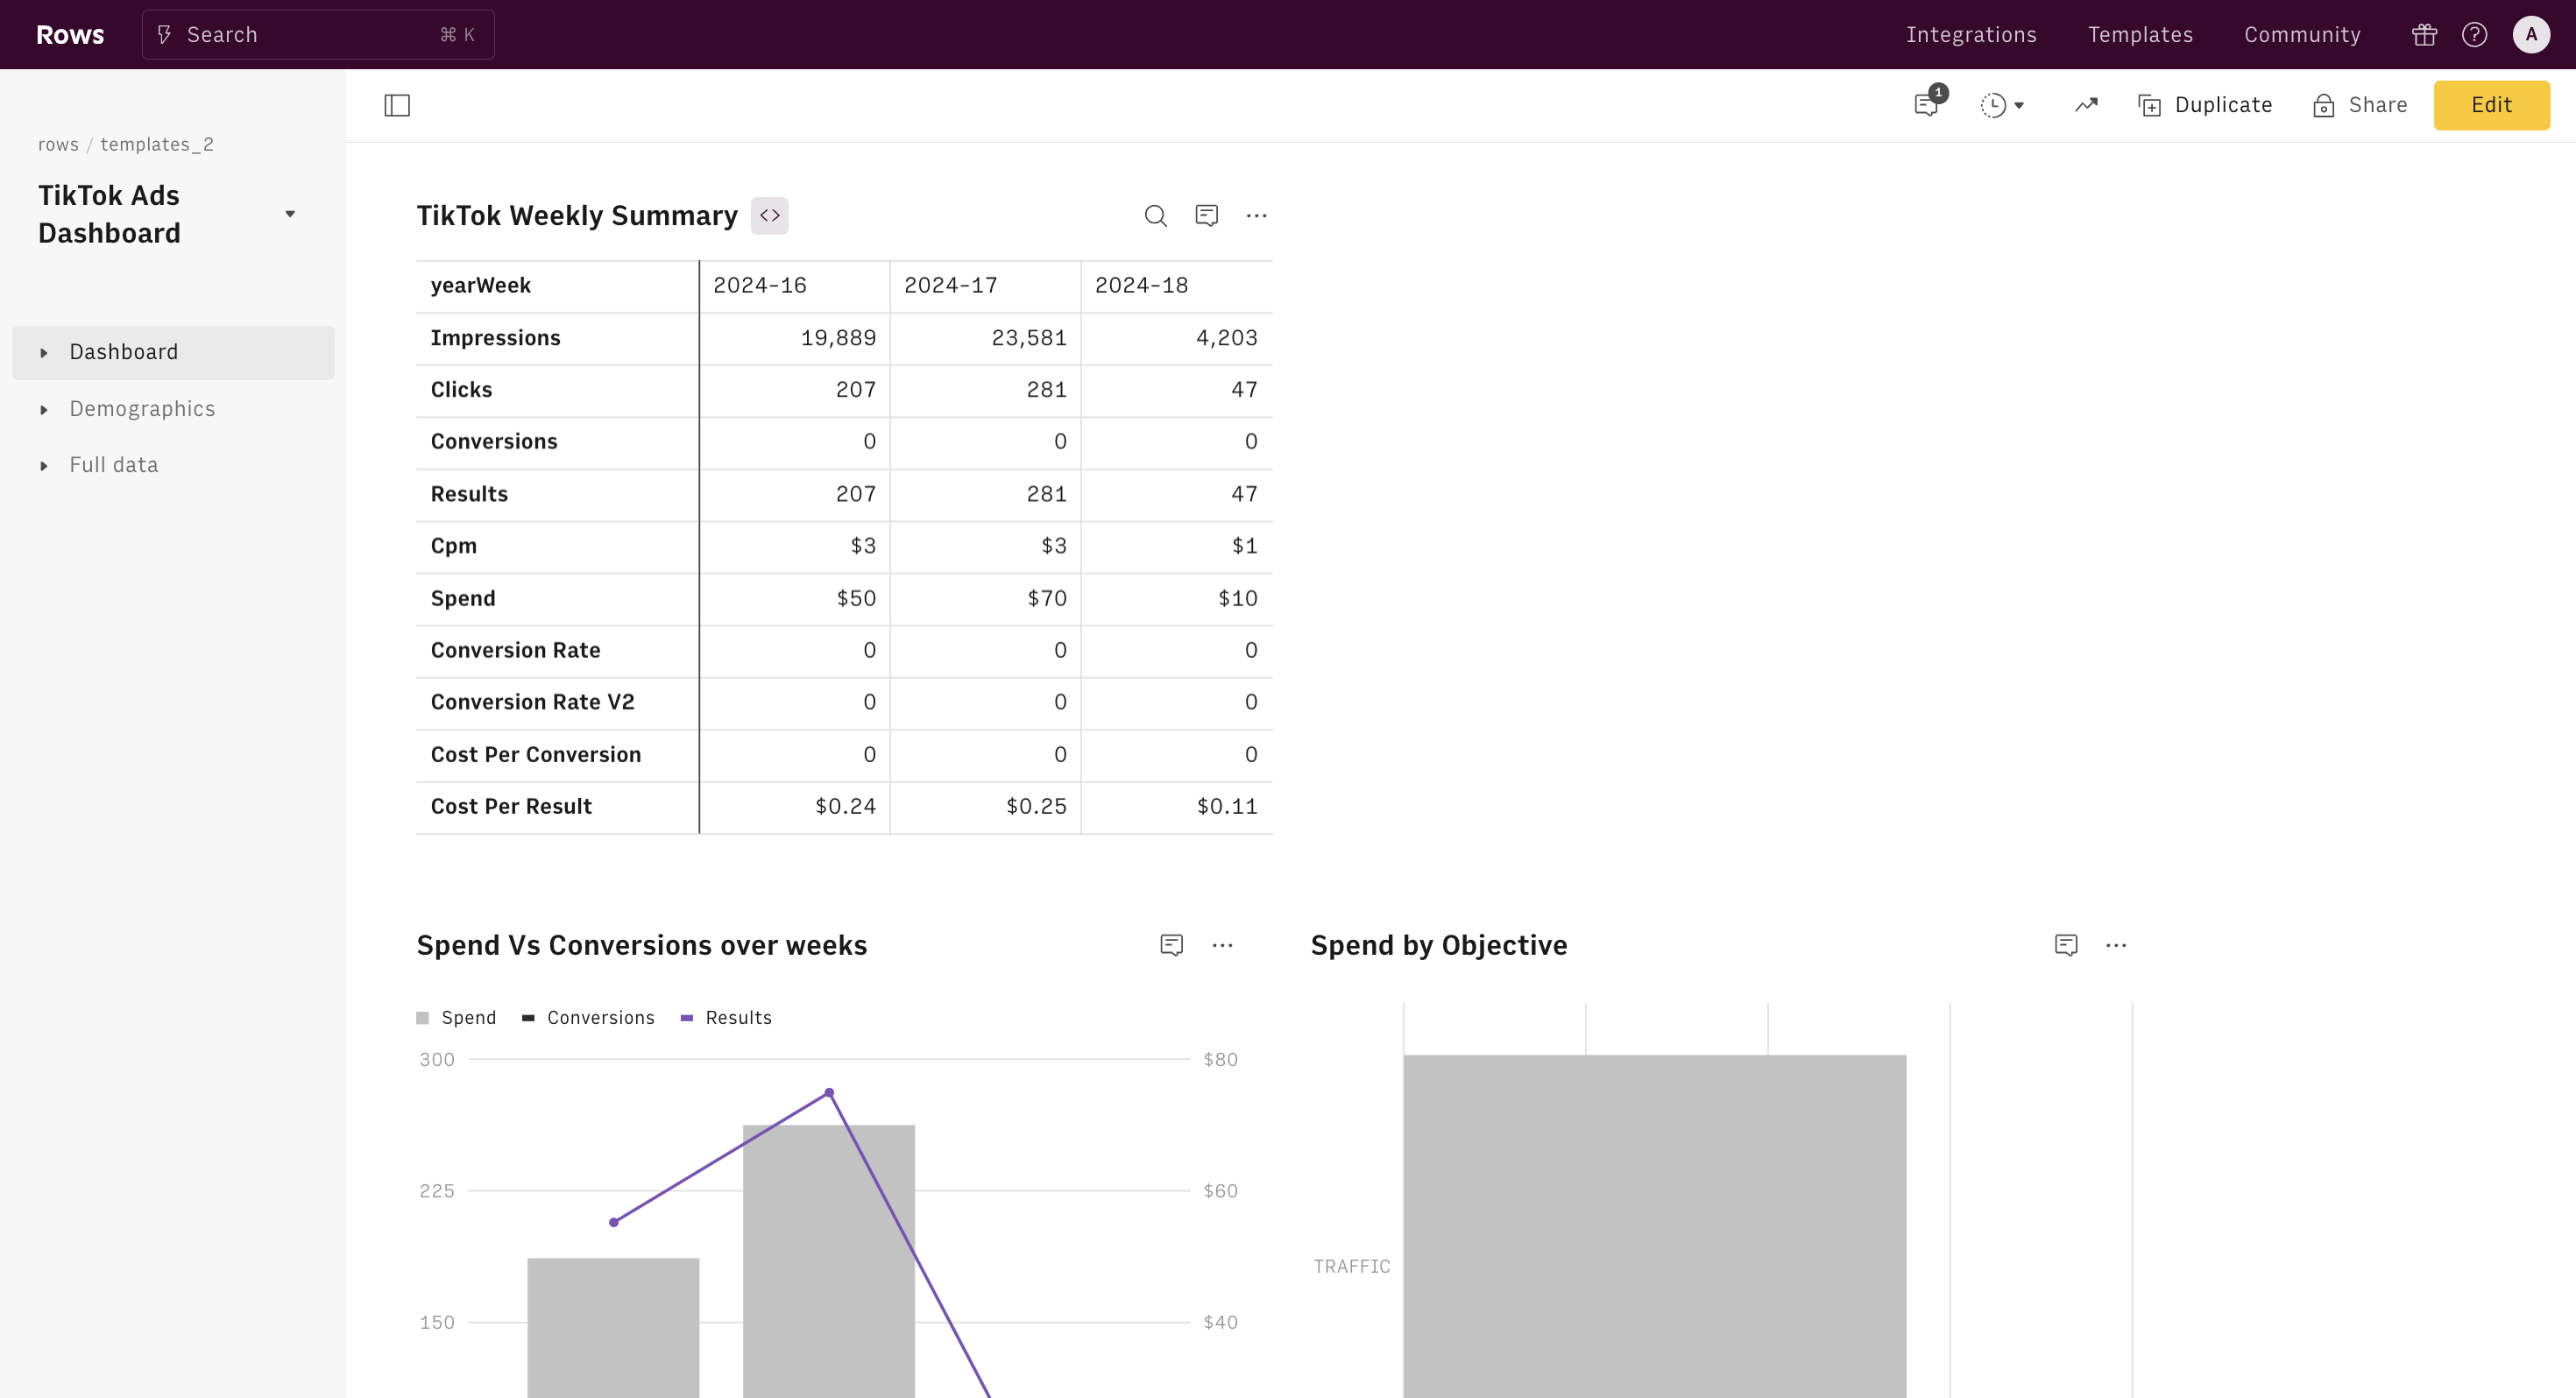
The TikTok Ads Reporting Interface is part of the TikTok Ads Manager, a tool designed to help advertisers monitor and manage their ad campaigns. This interface provides detailed data on various metrics such as impressions, clicks, conversions, and more. It allows users to track campaign performance in real-time and make informed decisions to enhance their marketing efforts.
To access the TikTok Ads Reporting Interface, you need to have a business account on TikTok. Once set up, you can log in to the Ads Manager and navigate to the "Reports" section to view your campaign data.
Key Metrics to Track in TikTok Ads Reports
When analyzing your TikTok ads, several key metrics can provide valuable insights into the effectiveness of your campaigns. Here are some of the most important ones:
1. Impressions
Impressions measure how many times your ad was shown to users. This metric gives you an idea of your ad's reach and visibility.
- Why it matters: High impressions indicate that your ad is being seen by a large audience.
- How to calculate: Impressions = Reach × Frequency
- Benchmark: Varies based on your target audience and campaign settings.
2. Clicks (Destination)
This metric tracks the number of times users clicked on your ad and were redirected to a specific destination, such as a website or app.
- Why it matters: Clicks indicate user interest in your ad and how well your message resonates with your audience.
- How to calculate: Total clicks from your ad.
- Benchmark: No fixed benchmark; depends on your niche and engagement level.
3. Click-Through Rate (CTR)
CTR measures the percentage of users who clicked on your ad after seeing it.
- Why it matters: A high CTR indicates that your ad is engaging and effective at driving traffic.
- How to calculate: CTR = (Clicks / Impressions) × 100
- Benchmark: Average CTR is around 0.84%, but can vary based on your campaign type.
4. Conversion Rate (CVR)
CVR measures the percentage of users who clicked on your ad and completed a desired action, such as making a purchase or signing up for a newsletter.
- Why it matters: CVR is a direct indicator of your ad's effectiveness in driving conversions.
- How to calculate: CVR = (Conversions / Clicks) × 100
- Benchmark: A good CVR ranges between 2-5%, depending on your industry.
Navigating the TikTok Ads Manager
Once you're logged into the TikTok Ads Manager, you'll find several sections that help you manage and analyze your campaigns. Here’s a breakdown of the main areas:
1. Campaign Overview
This section provides a summary of your current campaigns, including total spend, impressions, clicks, and conversions.
2. Ad Performance
Here, you can view detailed performance data for each individual ad, including metrics like CTR, CVR, and engagement rates.
3. Audience Insights
This feature allows you to analyze the demographics of your audience, including age, gender, location, and interests.
4. Creative Library
The Creative Library is a great resource for exploring trending ad formats and creative elements used by other advertisers.
Advanced Reporting Tools

For more in-depth analysis, you can use third-party tools like Coupler.io or PPC dashboards to consolidate and visualize your TikTok Ads data alongside other platforms like Facebook and Google Ads. These tools allow you to track multiple metrics in one place and gain a comprehensive view of your advertising performance.
1. Using Coupler.io for TikTok Ads Reporting
Coupler.io offers a range of templates and connectors to help you automate your TikTok Ads reporting. You can easily track metrics like ROAS (Return on Ad Spend), CPM (Cost per 1000 Impressions), and CPC (Cost per Click).
2. Creating Custom Reports
If you prefer a more tailored approach, you can create custom reports using spreadsheets or BI tools like Google Sheets, Looker Studio, Power BI, or Tableau. This allows you to filter and analyze data according to your specific needs.
Tips for Optimizing Your TikTok Ads
To get the most out of your TikTok Ads, consider the following tips:
- Test different ad formats: Experiment with Spark Ads, non-Spark Ads, and video formats to see what resonates best with your audience.
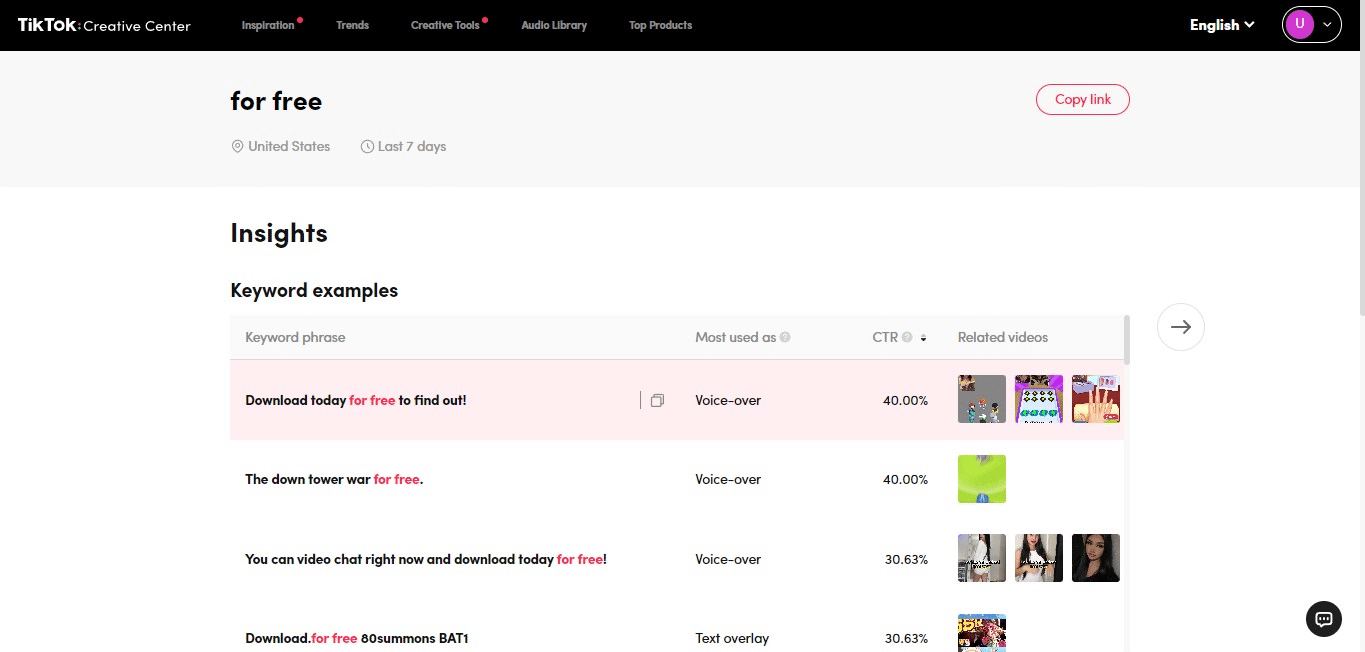
- Leverage trending content: Use TikTok's Creative Center to identify popular trends and incorporate them into your ads.
- Optimize your landing pages: Ensure that your landing pages are mobile-friendly, fast-loading, and aligned with your ad messaging.
- Monitor competitor ads: Use tools like PiPiADS or Minea to analyze your competitors' strategies and gain insights into their tactics.
Conclusion

Navigating the TikTok Ads Reporting Interface is essential for any marketer looking to succeed on the platform. By understanding key metrics, leveraging advanced reporting tools, and continuously optimizing your campaigns, you can maximize your return on investment and stay ahead of the competition.
Whether you're just starting out or looking to refine your existing strategy, the TikTok Ads Manager provides the tools and insights needed to drive meaningful results. With the right approach, you can turn your TikTok ads into a powerful marketing asset.
Posting Komentar untuk "How to Navigate TikTok Ads Reporting Interface: A Complete Guide"
Posting Komentar